
OSSE reports both four-year and five-year adjusted cohort graduation rates (ACGR) for public schools in the District, in accordance with US Department of Education guidelines. We calculate these two rates by taking the number of students who graduate with a regular high school diploma in either four or five years and divide by the number of students who form the adjusted cohort for the graduating class.
Understanding the ACGR
Calculating the ACGR may sound easy, but the word adjusted adds a little complexity. Students who are entering ninth grade for the first time form a cohort, which is then adjusted by adding any students who transfer into the cohort later during the next three (or four) years and subtracting any students who transfer out, emigrate to another country, or are deceased during that same period. For example, if a student enrolls in a public school in the District in 10th grade and graduates after 12th grade, we count them. Conversely, if a student enrolls in a diploma-granting school in 11th grade for the 2021-22 school year through an official exchange program and the student or their parent/legal guardian provide evidence that the exchange program has been completed following that year, the student is removed from the 2019-20 first ninth-grade year cohort. Adjusting the cohort is important so that we accurately capture all potential graduates for reporting purposes, but tracking students over time does make calculating the ACGR very complicated.
Recent Findings
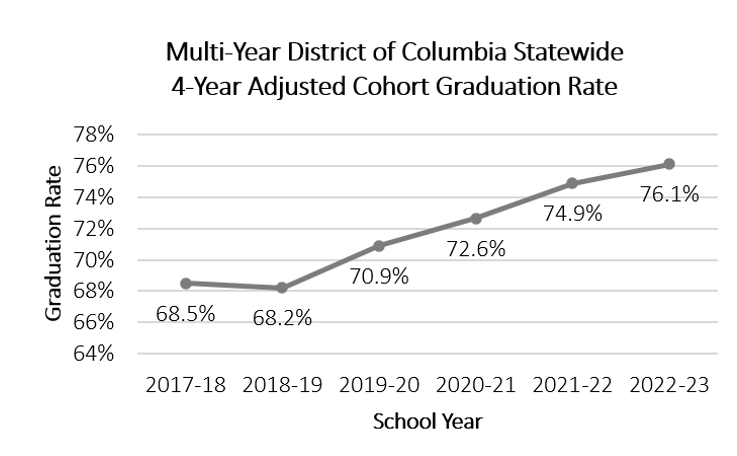
For the last four years, graduation rates have been rising in the District (see Figure 1).
Specifically, the four-year ACGR for the 2022-23 school year increased by a little more than 1-percentage point over the previous school year, with 76.1 percent of students in the District graduating high school in four years. The five-year graduation rate for the 2022-23 school year is 78.5 percent, which is also a little more than a 1-percentage-point increase.
Figure 1. Multi-Year District of Columbia Statewide Four-Year Adjusted Cohort Graduation Rate
Since OSSE began using ACGR in the 2010-11 school year, the graduation rate for the District has increased by more than 15 percentage points (see Table 1).
Table 1. Multi-Year District of Columbia Statewide 4-Year Adjusted Cohort Graduation Rate
| 2011-2012 | 61.0% |
| 2012-2013 | 61.5% |
| 2013-2014 | 65.4% |
| 2014-2015 | 69.2% |
| 2016-2017 | 72.4% |
| 2017-2018 | 68.5% |
| 2018-2019 | 68.2% |
| 2019-2020 | 70.9% |
| 2020-2021 | 72.6% |
| 2021-2022 | 74.9% |
| 2022-2023 | 76.1% |
In addition to calculating rates for District students overall, we also look at rates for students served by DC Public Schools (DCPS) and students served by public charter schools (see Table 2). The four-year graduation rate for DCPS) is 75.3 percent, an increase of 2.8 percentage points from the previous year. The five-year graduation rate is 75.5 percent, an increase of 0.6 percentage points. The four-year graduation rate for public charter schools is 79.4 percent, a slight decrease of 0.7 percentage points from the previous year. The five-year graduation rate is 84.4 percent, an increase of 2.4 percentage points.
Table 2. ACGR Rates Across Sectors
| 4-Year ACGR | 5-Year ACGR | |
| Statewide | 76.1% | 78.5% |
| DCPS | 75.3% | 75.5% |
| PCS | 79.4% | 84.4% |
OSSE also reports graduation rates for various student groups. We have seen increases in graduation rates for most student groups for both the four-year and five-year graduation rates (see Tables 3, 4, and 5).
Table 3. ACGR Rates Across Race/Ethnicity
| Race/Ethnicity | 4-Year AGCR | 4-Year AGCR | 5-Year AGCR | 5-Year AGCR |
| SY21-22 | SY22-23 | SY21-22 | SY22-23 | |
| American Indian/Alaskan Native | n<10 | n<10 | >90.0% | n<10 |
| Asian | 94.5% | 92.9% | 91.2% | 94.5% |
| Black/African American | 73.6% | 74.3% | 75.5% | 78% |
| Hispanic/Latino of Any Race | 68.4% | 70.3% | 74.7% | 70.4% |
| Native Hawaiian/Other Pacific Islander | n<10 | n<10 | n<10 | n<10 |
| Two or More Races | 87.5% | 93.4% | 92.9% | 93.5% |
| White | 95.3% | 97.6% | 93.0% | 96.3% |
Table 4. ACGR Rates Across Support Status
| Support Status | 4-Year ACGR | 4-Year ACGR | 5-Year ACGR | 5-Year ACGR |
| SY21-22 | SY22-23 | SY21-22 | SY22-23 | |
| At-Risk Students | 63.2% | - | 68.6% | - |
| Overage Students | - | 42.4% | - | 48.9% |
| Economically Disadvantaged Students | - | 68.4% | - | 71.2% |
| English Learners | 54.3% | 58.0% | 66.6% | 58.0% |
| Students with Disabilities | 58.1% | 62.4% | 64.6% | 65.1% |
Table 5. ACGR Rates Across Gender Identity
| Gender Identity | 4-Year ACGR | 4-Year ACGR | 5-Year ACGR | 5-Year ACGR |
| SY21-22 | SY22-23 | SY21-22 | SY22-23 | |
| Male | 81.0% | 82.2% | 82.0% | 84.0% |
| Female | 68.8% | 70.0% | 72.6% | 73.0% |
One important note is that some student groups are small. As part of OSSE’s Student Privacy and Data Suppression Policy, we do not report on student groups below the minimum n-size of 10 students. As such, some subtotals may not sum to the total number of students because these student groups are not reported in these data. We’ve also included some new student groups (economically disadvantaged, overage) this year that weren’t reflected in previous years, and discontinued reporting on the at-risk student group since that information is encompassed in the new groups.
If you want to take a deep dive into our graduation data, please check out the public files. We share all public data in Excel files so you can easily explore the data or import it into a data visualization application.