
The District of Columbia’s education ecosystem is unique. Families have the ability to choose a school that is right for their student and each of the District’s 69 local education agencies can set their own enrollment policies. This means that students can transition across schools during and between school years.* Additionally, the District’s small geographic footprint means that students may move only a few miles but move out of or into the District’s boundaries and therefore also move out of or into the District’s school systems.
Given these factors and the impact that transitioning schools can have on students, the Office of the State Superintendent of Education (OSSE) has always been interested in understanding the enrollment patterns and mid-year mobility of District students. OSSE has published mobility data since the 2012-13 school year – first in the DC Equity Reports and then on the DC School Report Card. These reports show cumulative entries and exits by month, represented as a percent of the school’s enrollment as of the annual enrollment audit.
However, OSSE heard from stakeholders that more information was needed about where students were going and where they were coming from. In order to provide OSSE’s partners with more information about student mobility, OSSE has published files with more granular enrollment data for each school year from 2018-19 to 2023-24 and OSSE will continue to update these files on an annual basis moving forward. These files include information, by sector, on transfers to and from a different sector, out-of-state, or juvenile justice settings; it also includes information on transfers within a sector. The files include these breakdowns for all students, compulsory-age students, K-12 students, pre-K students, and adult students.
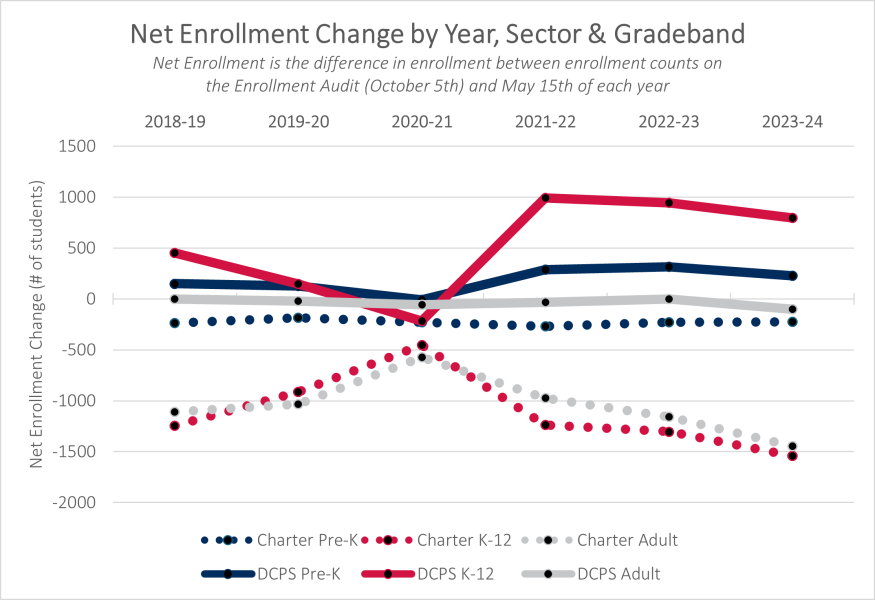
The graph below shows the net enrollment changes in each school year by sector and grade band. The dotted lines represent enrollment in the charter sector and the solid lines represent changes in enrollment in DC Public Schools (DCPS). The graph highlights the changes in mobility during the COVID-19 public health emergency, particularly in the 2020-21 school year when students mostly attend school virtually and net enrollment changes were smaller than in other years across all grade bands and sectors. Since 2020-21, net enrollment changes have grown to be greater than they were prior to the pandemic, in the 2018-19 school year.
OSSE will continue to work with our partners across DC to ensure that every student has a great place to go to school and to support students, families and educators when transitions between schools occur.

*The District of Columbia Public Schools (DCPS) serves as DC’s by-right local education agency (LEA) where every child of compulsory age (5) has a right to attend a given school based on their address regardless of the date of enrollment. Each public charter school (PCS) sets their own enrollment policies and determines whether they open available seats via MySchool DC and enroll students throughout the year.