


In the Division of Data, Assessment and Research (DAR), we were curious about what trends there may be in mid-year mobility and how student attendance may change before and after a mid-year transfer. In this two-part blog, we will explore those questions using data from the 2024–25 school year. In part 1, we show that student mobility varied based on many factors including student demographics, grade, and school type.
What is Mobility?
Mobility occurs when students enter (enroll) and/or exit (un-enroll) from a school in the middle of the school year, which we count between the annual enrollment audit in early October—this was Oct. 7 in the 2024–25 school year—and the end of May. See the endnotes for more details about who was included and excluded in this analysis.[i]
There are many ways to look at student mobility. In OSSE’s annual mobility reporting, we consider the total number of entries and exits at each school, each LEA, each sector, and in DC as a whole. For this investigation, however, we wanted to learn whether there’s a connection between student mobility and attendance, so we needed to look at each student’s entries and exits individually in order to connect them to attendance records. To that end, we’ve categorized all students into one of four mobility types based on whether they had any mid-year movement and, if so, what kind (see Table 1). Overall, most students (around 93 percent) were classified as non-mobile—which means they were enrolled at one school for the full academic year—and two to three percent of students fell into each of the other categories.ii
Table 1: Mobility Types

Which Students Are More Mobile?
Figure 1 shows the share of students in each demographic group by mobility type. In contrast to non-mobile students, students in the other mobility types were more likely to be economically disadvantaged; specifically, 49 percent of non-mobile students were economically disadvantaged compared to 62 percent of students with early exits, 58 percent with late entries, and 79 percent with mid-year transfers. Students who transferred mid-year were also more likely than non-mobile students to be Black (81 percent vs. 62 percent) or have a disability (22 percent vs. 19 percent). Additionally, English learners are much more frequent among students who entered late (27 percent) or exited early (18 percent) compared to non-mobile students (13 percent).
Figure 1: Student Demographics by Mobility Type

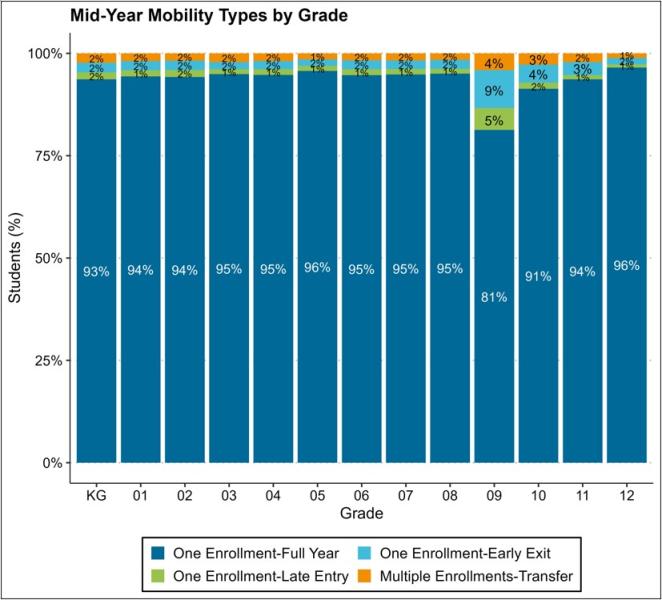
Mobility also varied by student grade (see Figure 2). In most grades, fewer than 7 percent of students had any mid-year mobility. In contrast, the most mobile grade by a significant margin was ninth grade with 18 percent having some kind of mid-year movement. The greater mobility in ninth grade is partially explained by two factors: grade repetition and alternative school attendance.
Figure 2: Mid-Year Mobility Types by Grade
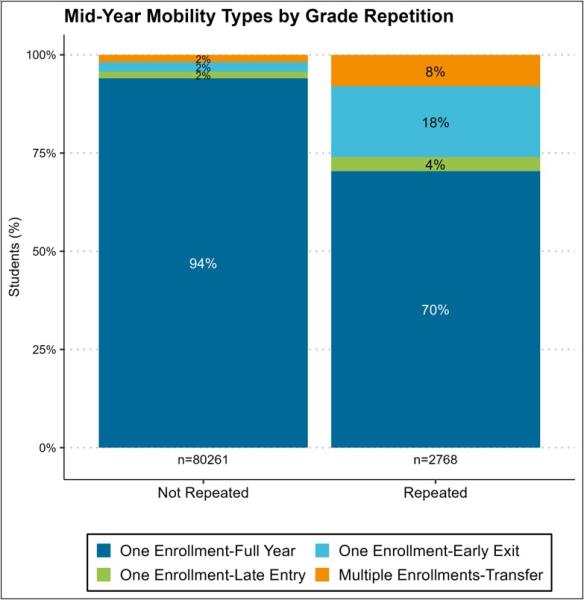
As shown in Figure 3, 30 percent of students who repeated the same grade from the prior year had mid-year mobility compared to only 6 percent of students who had been promoted to a new grade. In particular, students repeating a grade were four times more likely to transfer mid-year and nine times more likely to exit before the end of the year and not re-enroll.
Figure 3: Mid-Year Mobility Types by Grade Repetition
Additionally, by definition, alternative schools work with students who have unique educational needs and may experience more instability in their home and school lives. As shown in Figure 4, students who attended an alternative school experienced mid-year mobility much more often even with the additional support alternative schools provide.
In the 2024–25 school year, ninth graders made up more than one third of the K–12 students who attended alternative schools or who repeated a grade. Among ninth-grade students who were not repeating the grade and did not attend an alternative school, 90 percent stayed at one school for the full year, which is much closer to the percentage we found in other grades.
Figure 4: Mid-Year Mobility Types by Alternative School

What Are the Patterns among Mid-Year Transfers?
In part 2 of this blog, we will explore attendance patterns before and after a mid-year transfer, so for this last section, we’ll zoom in on just the students categorized with multiple enrollments in a single school year. This group is relatively small, comprising a little more than 1,700 students (about 2 percent), some of whom changed schools multiple times during the year.
Students did not transfer between schools at a consistent rate throughout the year. From the enrollment audit in October when we start counting mid-year mobility, the most common month to transfer is January and the least common is May (see Figure 5).
Figure 5: Mid-Year Transfers by Exit Month

Mid-year transfers were not distributed equally across sectors either. Sixty-one percent of all transfers started from DC Public Schools (DCPS) while 38 percent of transfers originated at a public charter school (Figure 6). At the same time, 82 percent of mid-transfers ended at DCPS, and 17 percent ended at a public charter school.
Figure 6: Mid-Year Transfers by Sector

In part two, we will look at how attendance patterns changed before and after a transfer among students with multiple enrollments in the 2024–25 school year. You can also learn more about DC’s mobility trends over time in this previous blog post or the annual mobility reports.
[1] The sample was narrowed to K–12 students who were enrolled for at least 21 days in a DC public or public charter school in the 2024–25 school year. Students were excluded if they were enrolled in juvenile justice settings or non-public placements at any time during the year because we do not have daily attendance data from those settings. Early exits were not counted if the student earned a verified credential (e.g., diploma, GED) or passed away.