


In the first part of this blog, we explored which students were mobile—experienced mid-year school changes in the 2024–25 school year—and the patterns for students who transferred mid-year. In this second part of the blog, we explore patterns in attendance by type of student mobility. We generally find lower attendance for students with mobility. In addition, for students who transferred mid-year, we find short-term dips and improvements in attendance around the transfer date yet no longer term changes in attendance patterns.
Do attendance rates vary by mobility type?
Figure 7 shows boxplots of attendance rates for students, grouped by their mobility type. A boxplot is a simple way to show how attendance is distributed within each group. Each student’s attendance rate is calculated by dividing the number of days they were present by the number of instructional days they were enrolled in DC public or public charter schools.
In each boxplot, the bottom of the box shows the attendance rate for the 25th percentile of students (those with lower attendance), the line in the middle shows the 50th percentile (the median), and the top of the box shows the 75th percentile (students with higher attendance).
Figure 7: Boxplot of Attendance Rates by Mobility Type
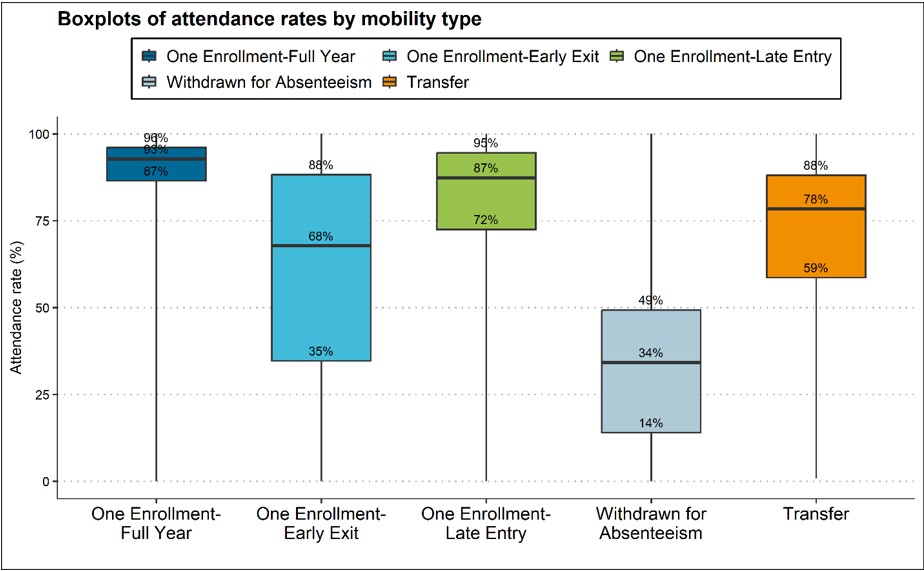
Figure 7 shows that students who move schools during the year tend to have lower attendance than students who stay in the same school for the full year. For example, the median attendance rate was 93 percent for students who remained in the same school, compared with 87 percent for students who enrolled late, 78 percent for students who transferred, and 68 percent for students who exited early.
We also examined attendance for students who were withdrawn due to the local education agency’s (LEA’s) policy related to absenteeism or truancy. Students who were withdrawn due to absenteeism had a much lower median attendance rate of just 34 percent.
The boxplots also show that attendance rates vary more widely for students who move mid-year. The wider boxes indicate a broader spread of attendance rates among mobile students compared with students who stayed in the same school all year.
Does attendance improve when transferring to another school?
As noted in part 1 of the blog, only about 2 percent of students transferred to another DC public or public charter school between the October enrollment audit and the end of May. In this section, we look at whether student attendance improved or worsened after they transferred mid-year.
Figure 8 shows daily average attendance for students who transferred, tracking attendance for the days leading up to the transfer and the days that follow. The left side of the figure shows daily attendance for students who did not remain in DC public and public charter schools for the full school year (defined as at least 175 instructional days), while the right side shows the same pattern for students who did remain enrolled for the full year.
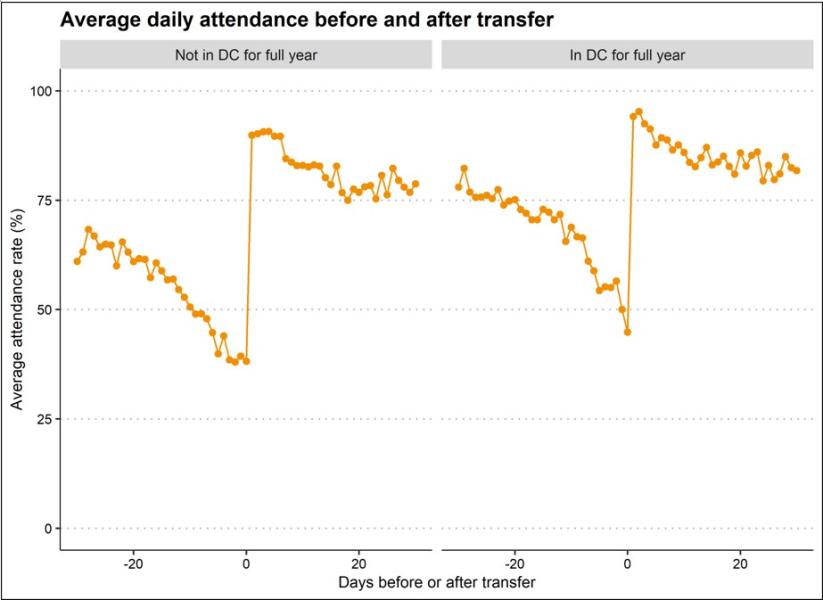
As shown in Figure 8, attendance begins to decline roughly 20 days before a mid-year transfer. After the transfer, attendance gradually returns to the student’s typical level within about 20 days. Overall, students who are not enrolled in a DC public or public charter school for the full school year tend to have lower attendance. Figure 9 shows the same data but zoomed in to make the values on the x-axis easier to see.
Figure 8: Average Daily Attendance Before and After Transfer
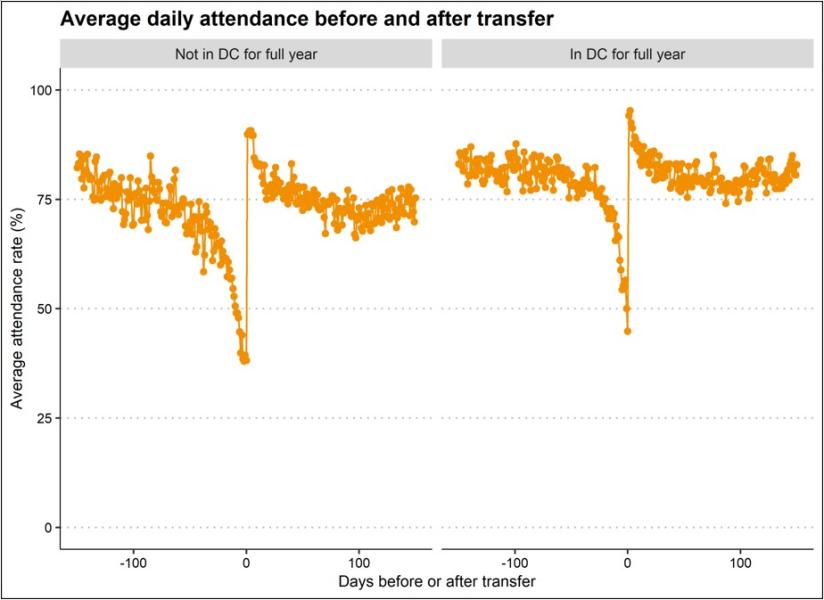
Figure 9: Average Daily Attendance Before and After Transfer, Zoomed In
We also examined whether these patterns varied based on the month students transferred or the grade they were in, and we found the same pattern across all groups. In addition, using daily attendance data, we examined whether a student’s likelihood of attending school on a given day changed after a transfer, while controlling for the number of instructional days, student fixed effects—meaning we hold constant all factors specific to each student—and an interaction term between the after-transfer indicator and number of instructional days. After also accounting for the fact that students are grouped within schools (and that attendance patterns may be similar within the same school), we did not find a statistically significant change in the odds of attending school following a transfer.
What are the implications?
One key takeaway from this analysis is that students who experience more school mobility tend to have worse attendance. Many students already face barriers getting to school, and mobile students may encounter even more of these challenges.[i] For example, in the 2024–25 school year, 79 percent of students who transferred mid-year were identified as economically disadvantaged, as shown in Figure 1 in part 1 of this blog.
Additionally, when students transfer to a new DC school, the receiving school does not receive the student’s prior attendance records if the student is coming from another LEA. Thus, another important implication is that LEAs and schools should be aware that mobile students generally have lower attendance and should proactively monitor attendance for incoming students. Ensuring that LEAs have the necessary funding and supports in place can help them better meet the needs of mobile students as soon as they arrive.
Another key takeaway is that attendance generally does not change in the longer term after a school transfer, suggesting that factors beyond the school influence attendance patterns for students who transfer mid-year. In the short term, attendance tends to drop right before a school transfer and then improve shortly after the transfer, but we do not know why this happens. It could be that students attend less in anticipation of transferring schools, or that consecutive days of unexcused absences leads to conversations with families about potential withdrawal, prompting them to transfer.
After a transfer, students may attend school more regularly in the short term to establish connections or for another reason. After a few weeks, attendance returns to previous levels likely because the same challenges and barriers that affected attendance before the transfer often remain. There may be other factors at play that we cannot observe in the data. Ultimately, ensuring strong systems and supports for mobile students can improve attendance and their overall school experience.[ii]
[i] See Advancing an Ecological Approach to Chronic Absenteeism by Singer et al. (2021); and School hopscotch: A comprehensive review of K–12 student mobility in the United States by Welsh (2017).
[ii] See Reducing Student Absenteeism by Gottfied, Page, & Edwards (2023); and Identifying Effective Attendance Strategies in Michigan by Singer et al. (2026).